
The best way to debug websites on iOS and iPadOS devices/simulators is by using the developer tools in Safari.
Step 1: Enable “Develop” menu for Safari on your Mac.
Essentially, this is the first step irrespective of which device/simulator you would be using.
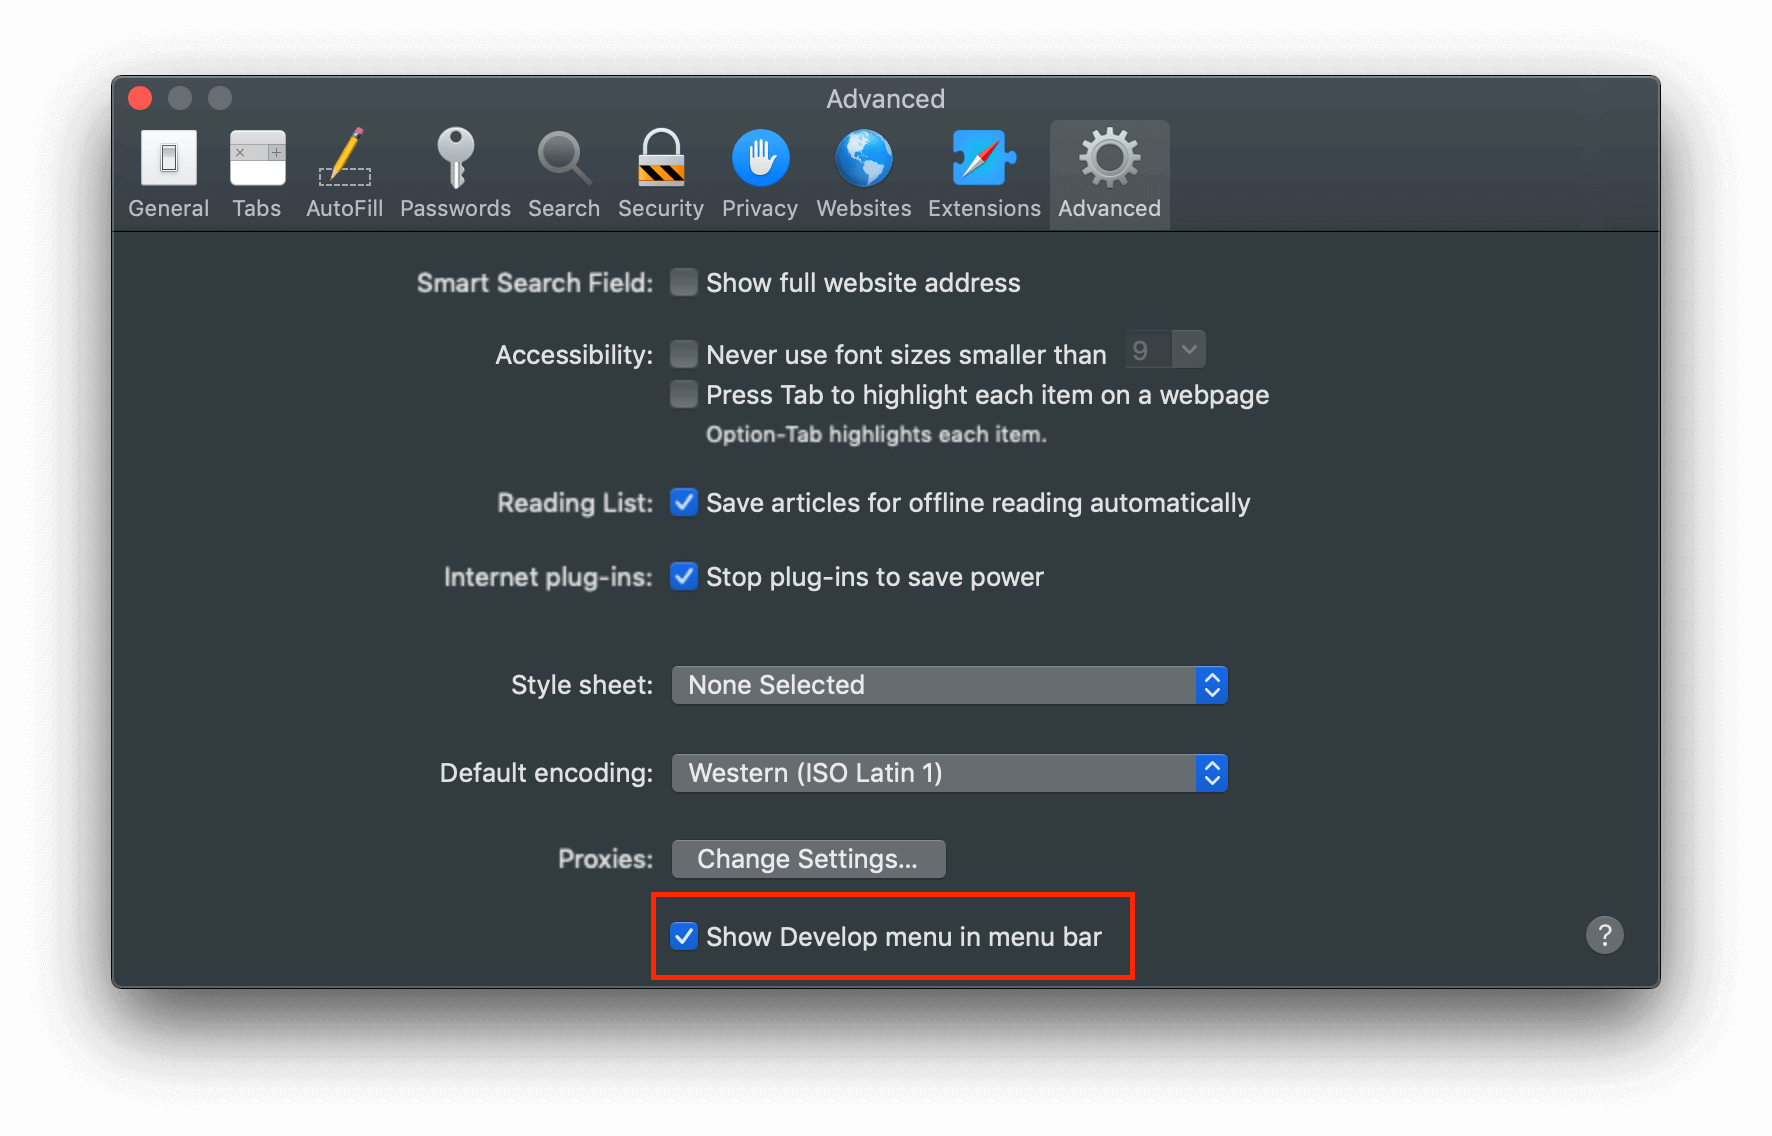
On your Mac, launch Safari and head over to Safari (menu option) > Preferences. Make sure you are on the “Advanced” tab.
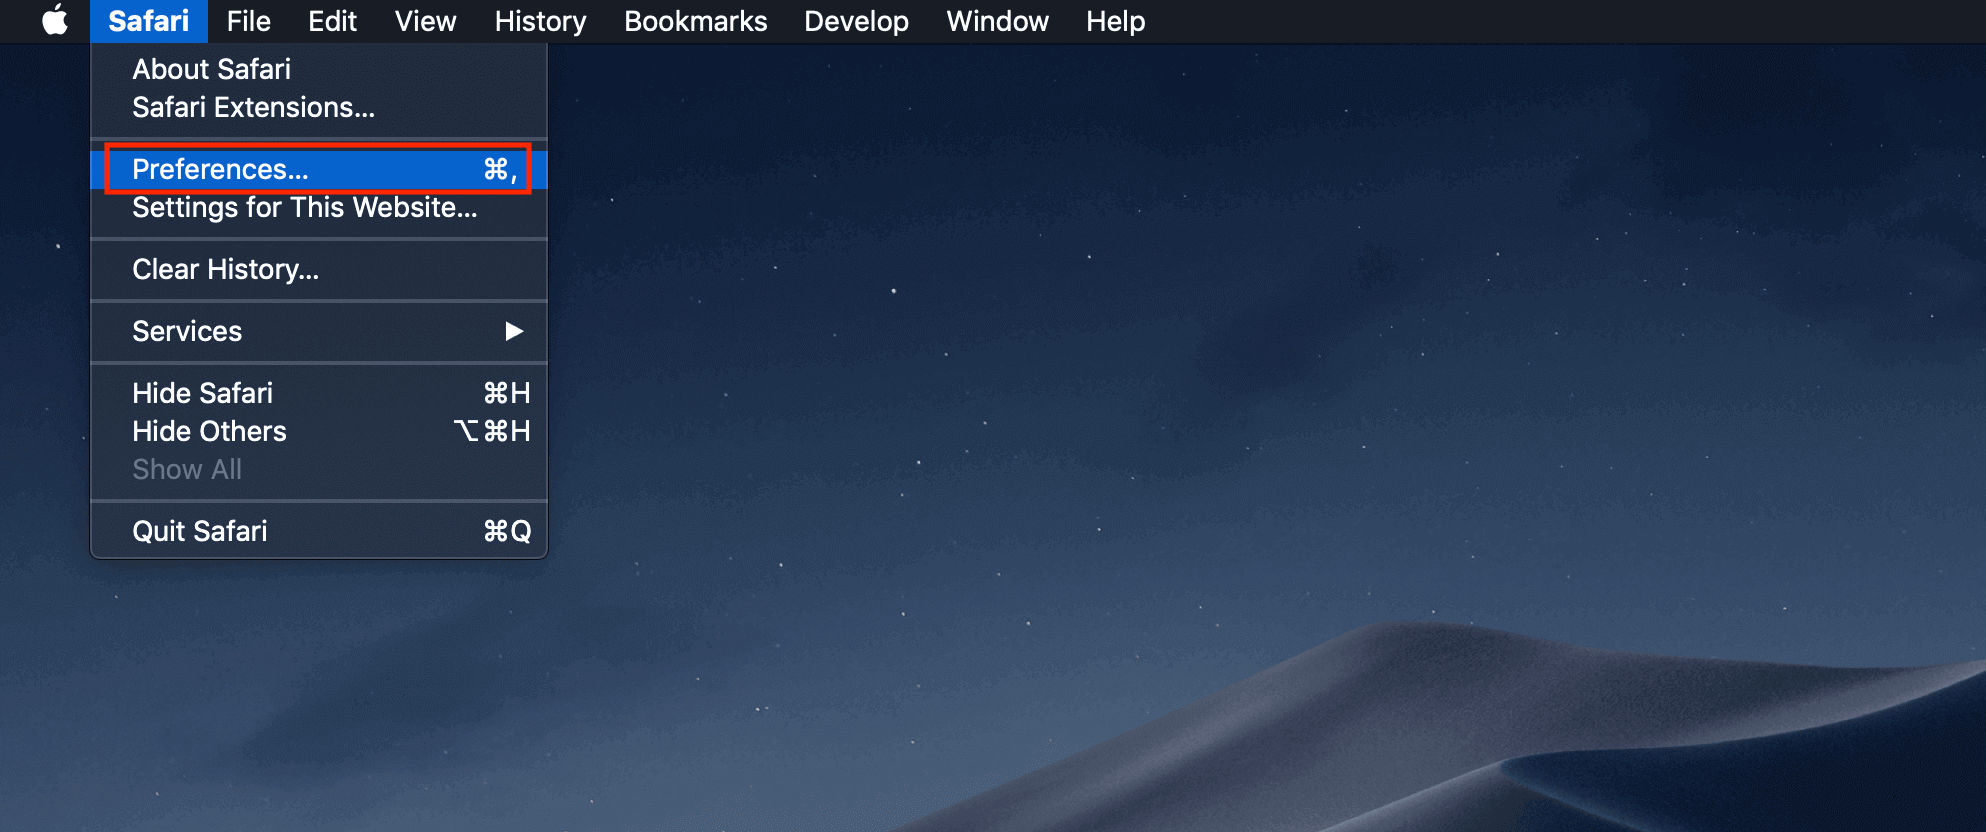
At the bottom, you would see a checkbox which says: “Show Develop menu in menu bar“, make sure it’s checked.
Step 2: Open a website in Safari on an iOS/iPadOS device or Simulator
- When using a Simulator to debug the website, open the Safari app and load the website.

Step 3: Launching the debugger tool in Safari
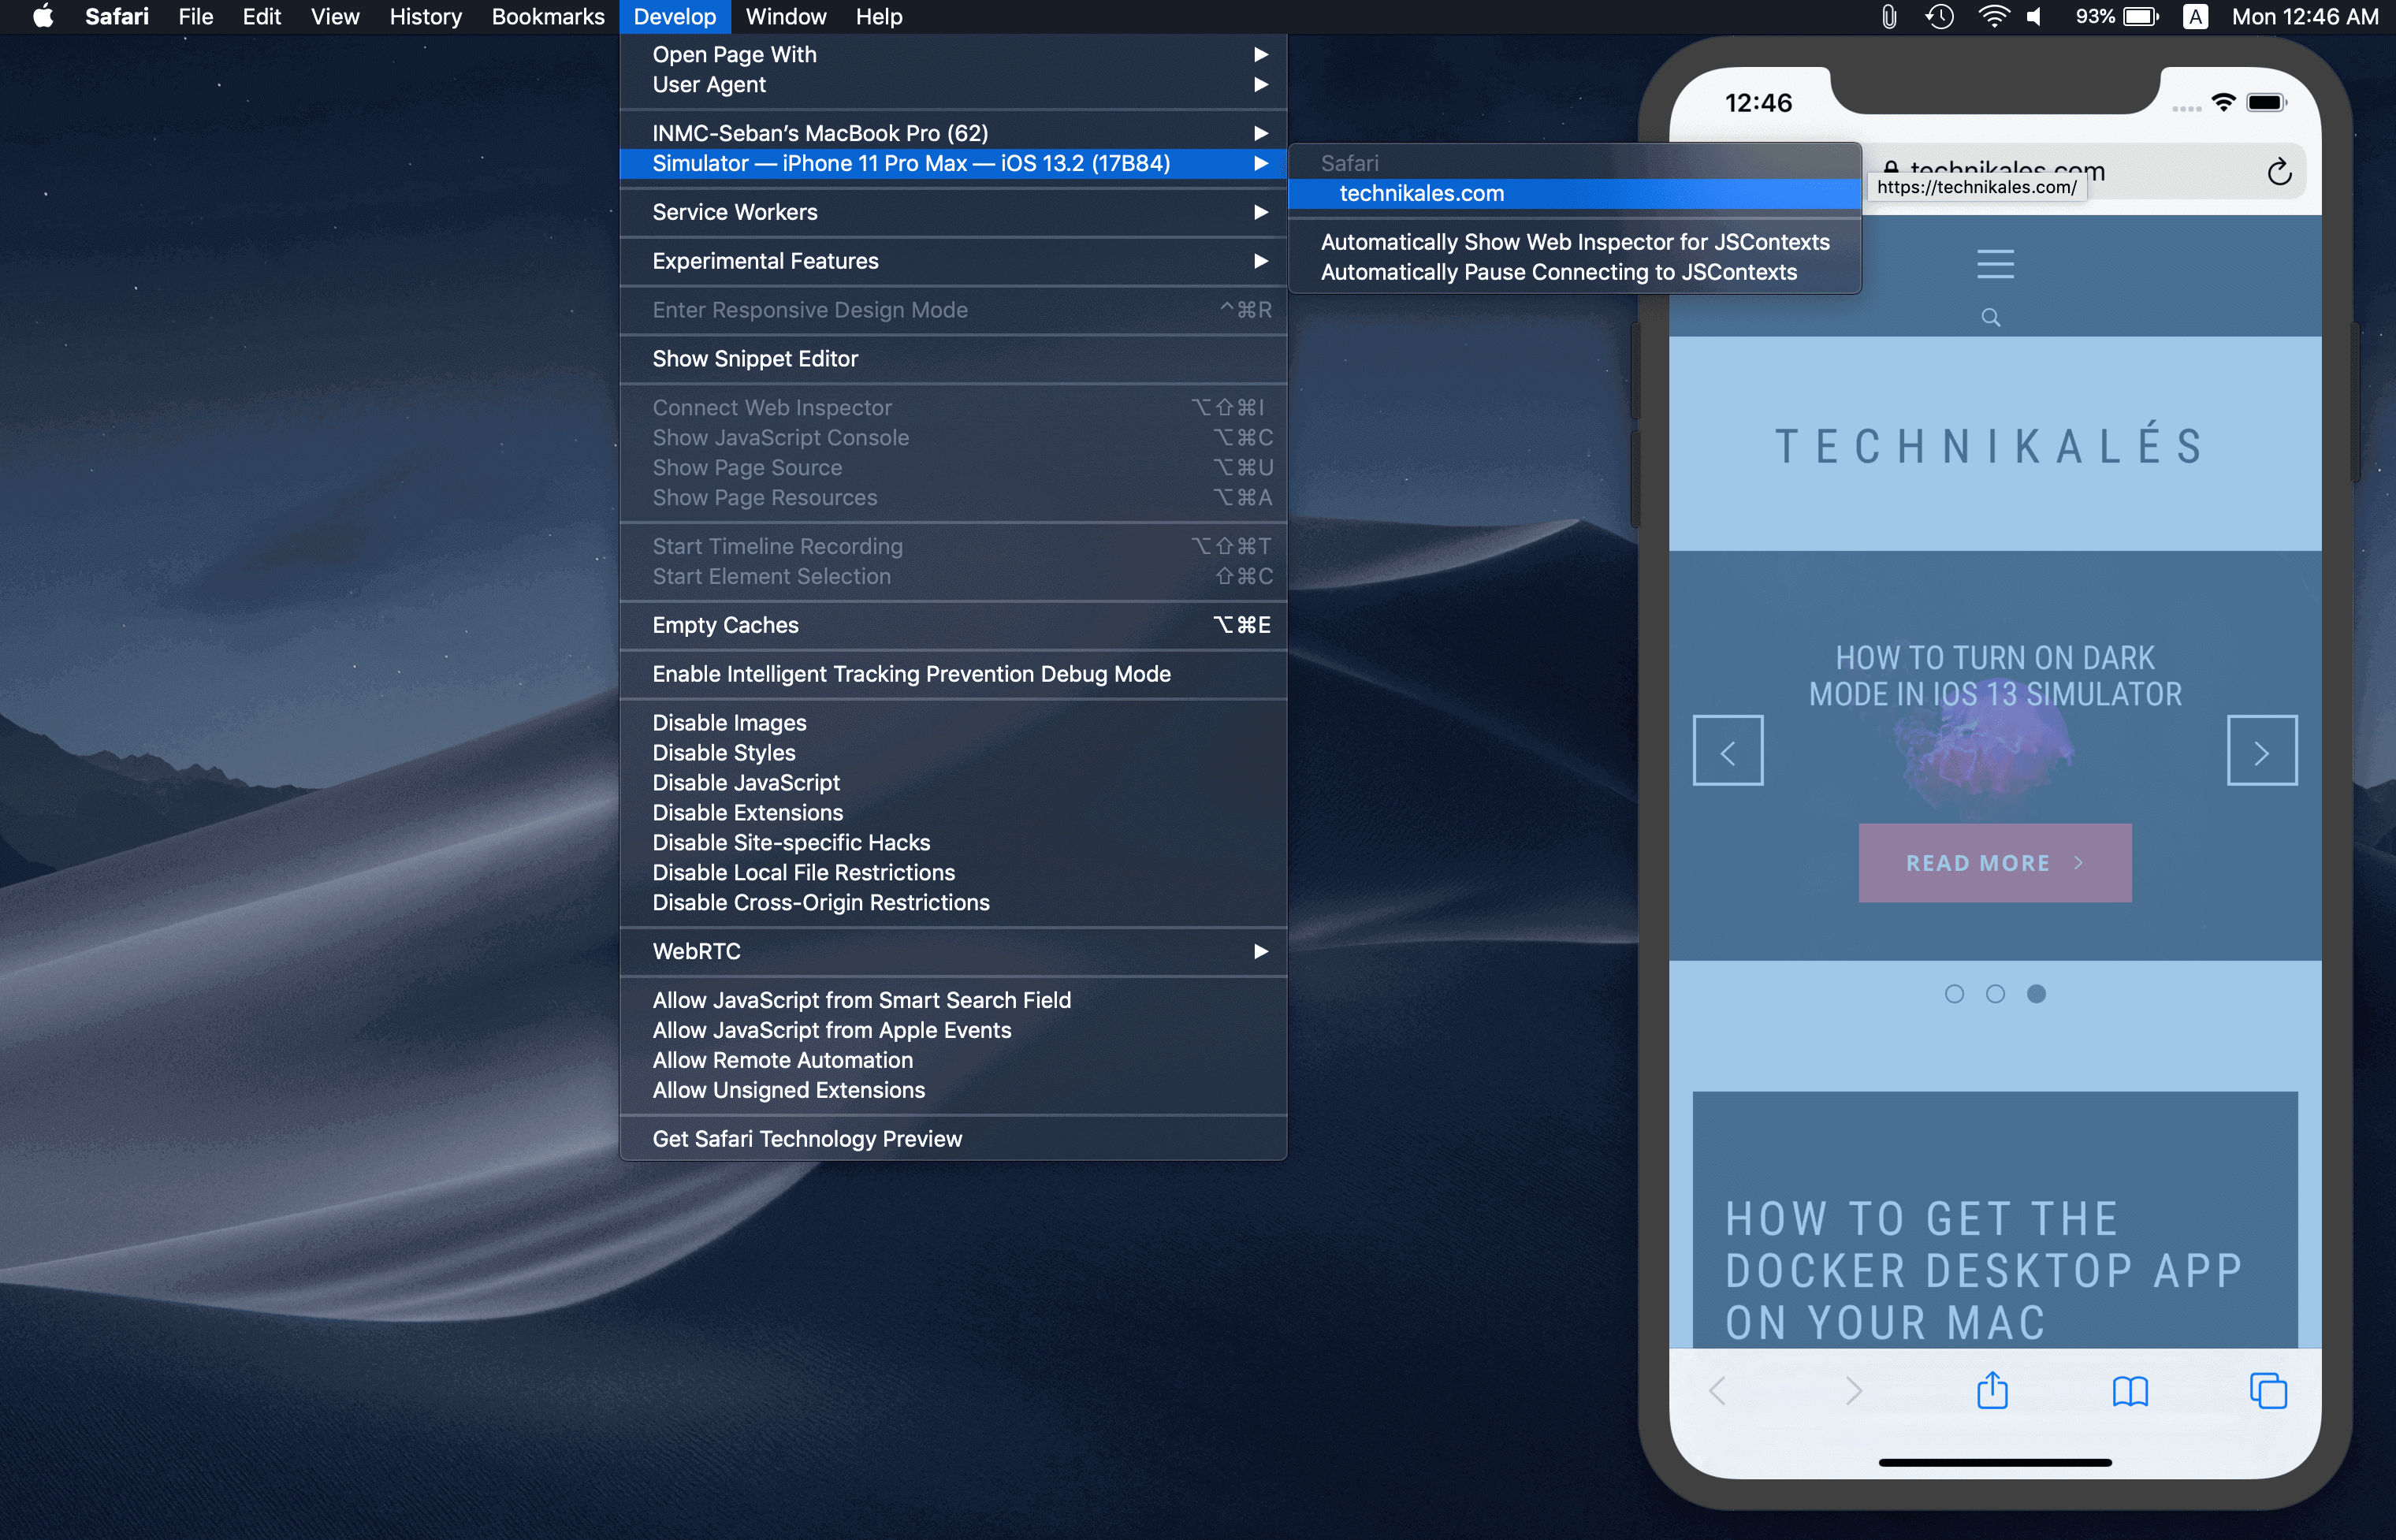
Once you’ve loaded the website on your iOS/iPadOS device or Simulator, restart Safari. Now, in Safari’s top menu bar head to the option “Develop”, click on it to view all the sections. The section we want is the second one, where you would see the name of the iOS/iPadOS device or the Simulator. Hover over the name to see the loaded application or website and click on it. Refer the image below.
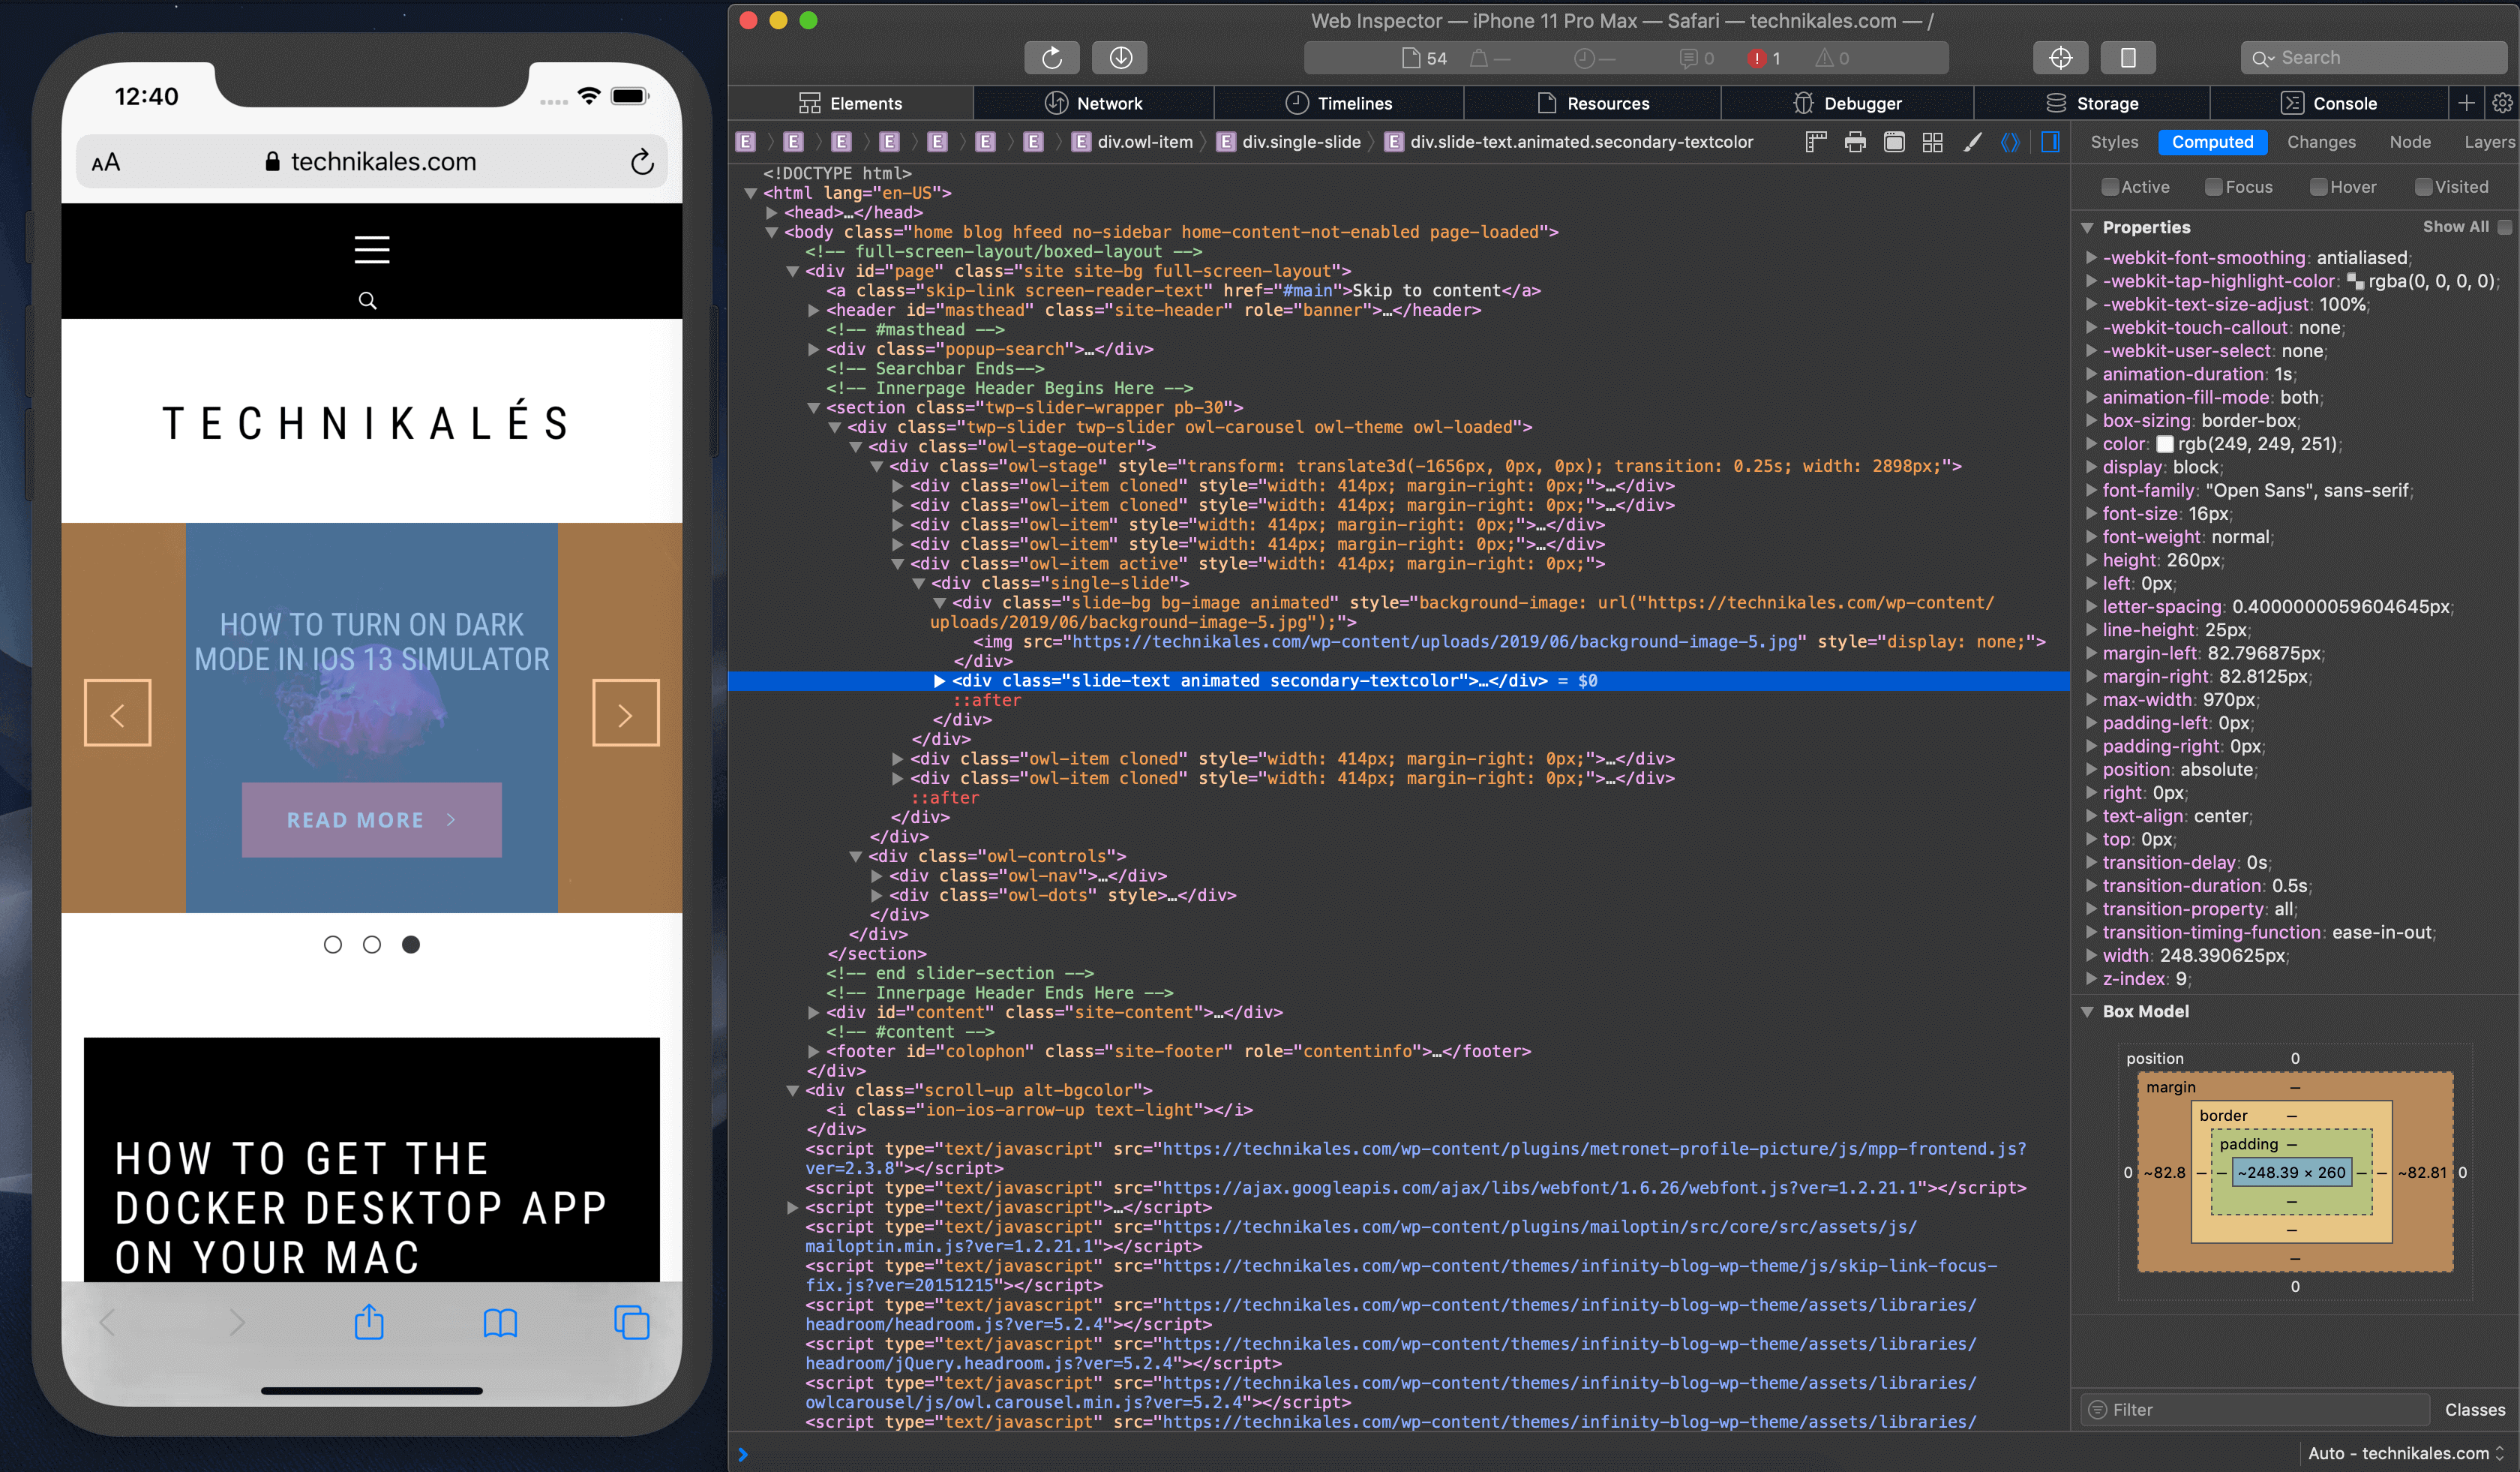
Step 4: Debug Away!
Now you should see the developer tools with all the beautiful HTML, CSS code and all the other goodies.
Leave a Reply